Gropu By
Multiple functions can also be applied at once. For instance, say we’d like to see how tip amount differs by day of the week - agg() allows you to pass a dictionary to your grouped DataFrame, indicating which functions to apply to specific columns.
SELECT day, AVG(tip), COUNT(*)
FROM tips
GROUP BY day;
/*
Fri   2.734737   19
Sat   2.993103   87
Sun   3.255132   76
Thur  2.771452   62
*/
In [21]: tips.groupby('day').agg({'tip': np.mean, 'day': np.size}) Out[21]: tip day day Fri 2.734737 19 Sat 2.993103 87 Sun 3.255132 76Comparison with SQL — pandas 1.0.3 documentation
日付でまるめる
Series.dt.round()に渡す第一引数を”D”にします。
df['datetime'] = df['datetime'].dt.round("D")
print(df)
結果
    datetime
0 2018-04-02
1 2019-05-01
[python] pandasのdatetimeを日、時間、週などに丸める方法
ユニークな値をカウントする
df = pd.DataFrame({'A': [1, 2, 3], 'B': [1, 1, 1]}) df.nunique() A 3 B 1 dtype: int64df.nunique(axis=1) 0 1 1 2 2 2 dtype: int64pandas.DataFrame.nunique — pandas 1.0.3 documentation
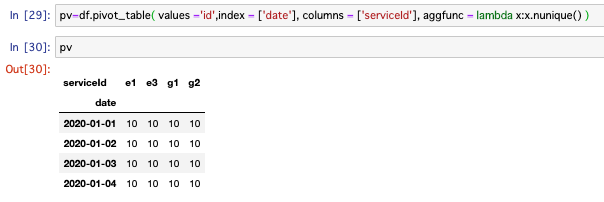
ピボットテーブルでユニーク値をカウントする
- コード
import pandas as pd
pv=df.pivot_table( values ='id',index = ['date'], columns = ['serviceId'], aggfunc = lambda x:x.nunique() )
- 実行結果

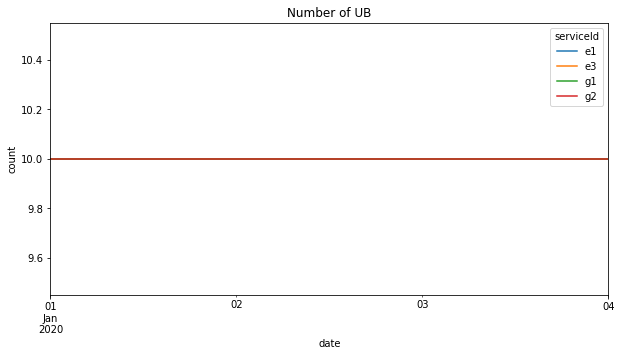
ピボットテーブルを折れ線グラフで表示する
- コード
pv=df.pivot_table( values ='id',index = ['date'], columns = ['serviceId'], aggfunc = lambda x:x.nunique() )
pv.plot(figsize=(10,10), title="Title")
plt.ylabel("count")
plt.show()
- 実行結果

- 参考:
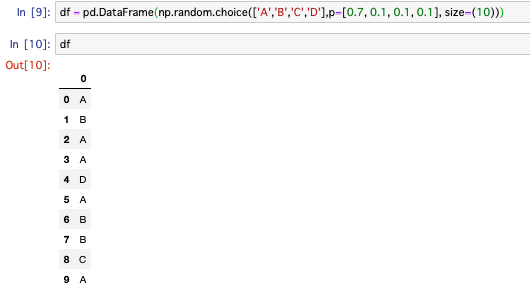
numpy の random.choice で重み付けをする
- コード
df = pd.DataFrame(np.random.choice(['A','B','C','D'],p=[0.7, 0.1, 0.1, 0.1], size=(10)))
- 実行結果
